
Moneylogz App · Dashboard
Everything, at a glance.
The Dashboard is the first screen after you sign in. It holds nothing of its own: every figure comes from Accounts, Documents, Transactions or Investments, and every panel links back to the screen it came from.
Choose the window
The 7d, 30d, 90d, YTD and 2y buttons set the period the Dashboard covers. It opens on 30 days; 2y is as far back as your bank shares.
- The range moves what describes a period: Spending, Recent activity, the trades counted under your portfolio.
- It never moves your balances. Net worth and the meters are what your accounts hold now.
- Refresh re-reads what the four screens already hold. Banks send new data on their own schedule, typically one to three times a day.
Balances across the top
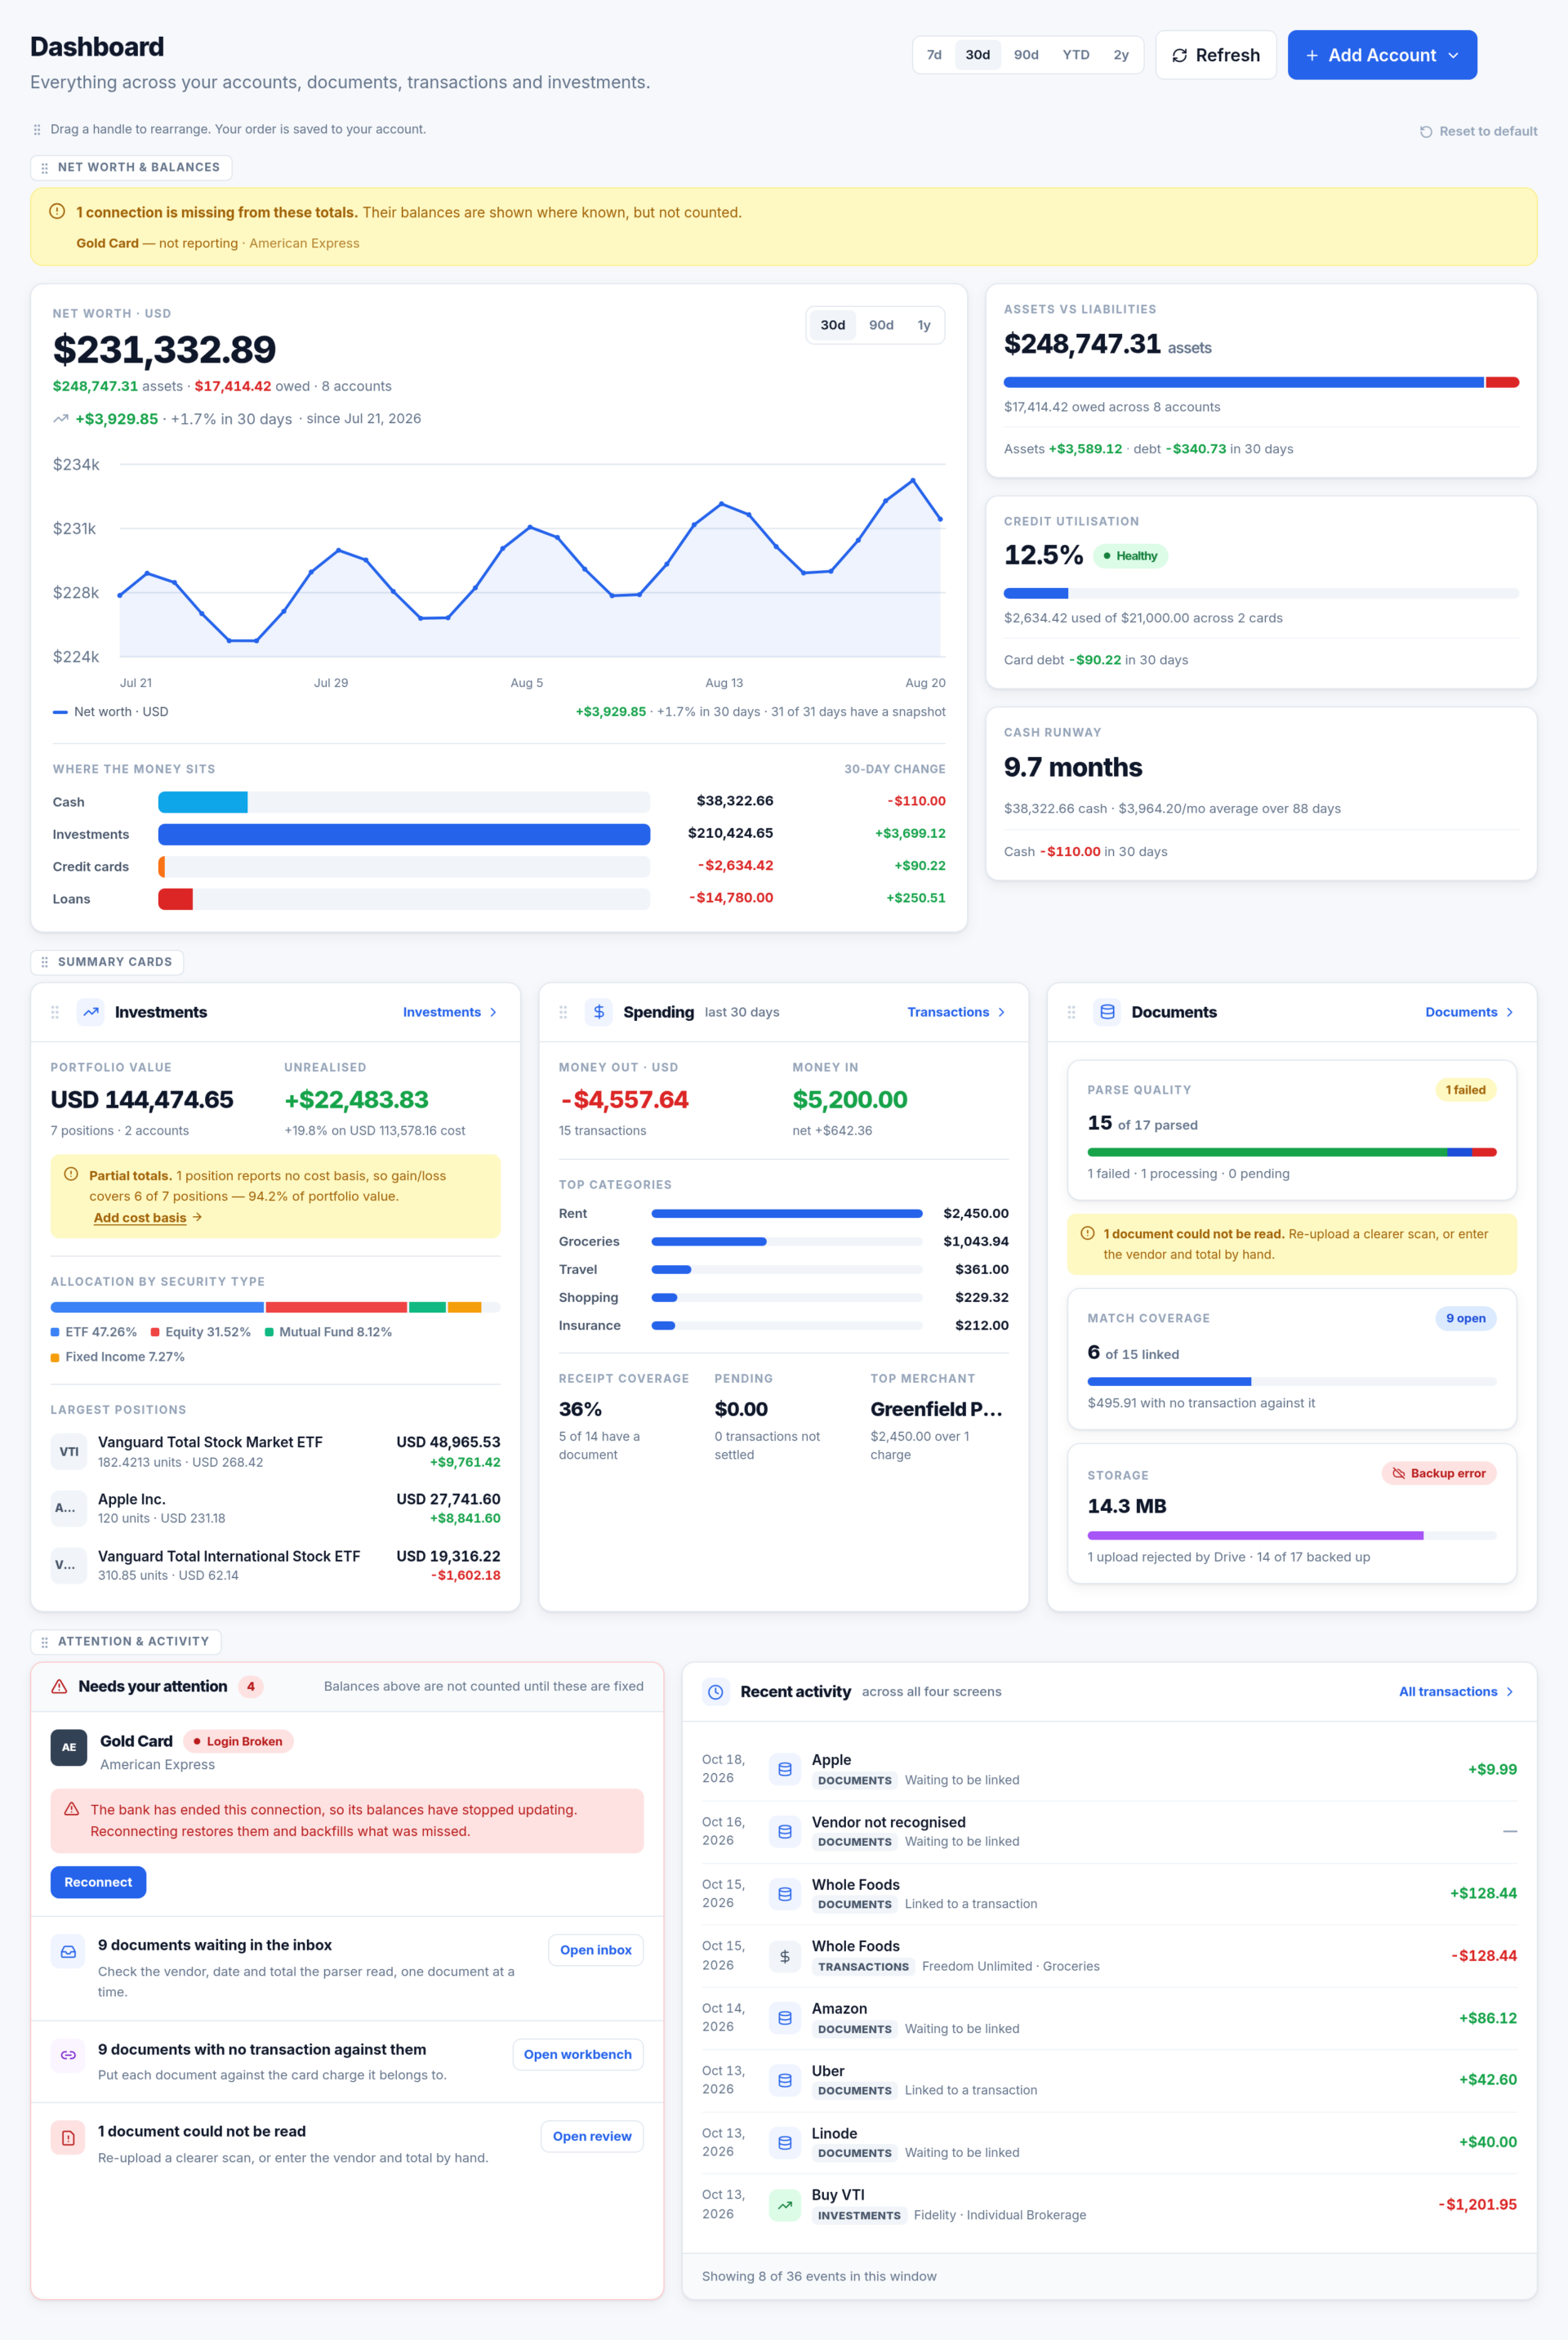
The hero repeats the Accounts screen’s headline figures: net worth in your main currency, where the money sits by account type, and three meters beside it.
- Assets vs liabilities: what you hold against what you owe, in one bar.
- Credit utilisation: how much of your combined limit is drawn, badged Healthy, Watch or High.
- Cash runway: months of cash at your recent burn rate. Without a month of history it says so instead of showing a number.
A connection that is not reporting is named, not silently dropped. A yellow strip says how many are missing from the totals and which ones.
One card per screen
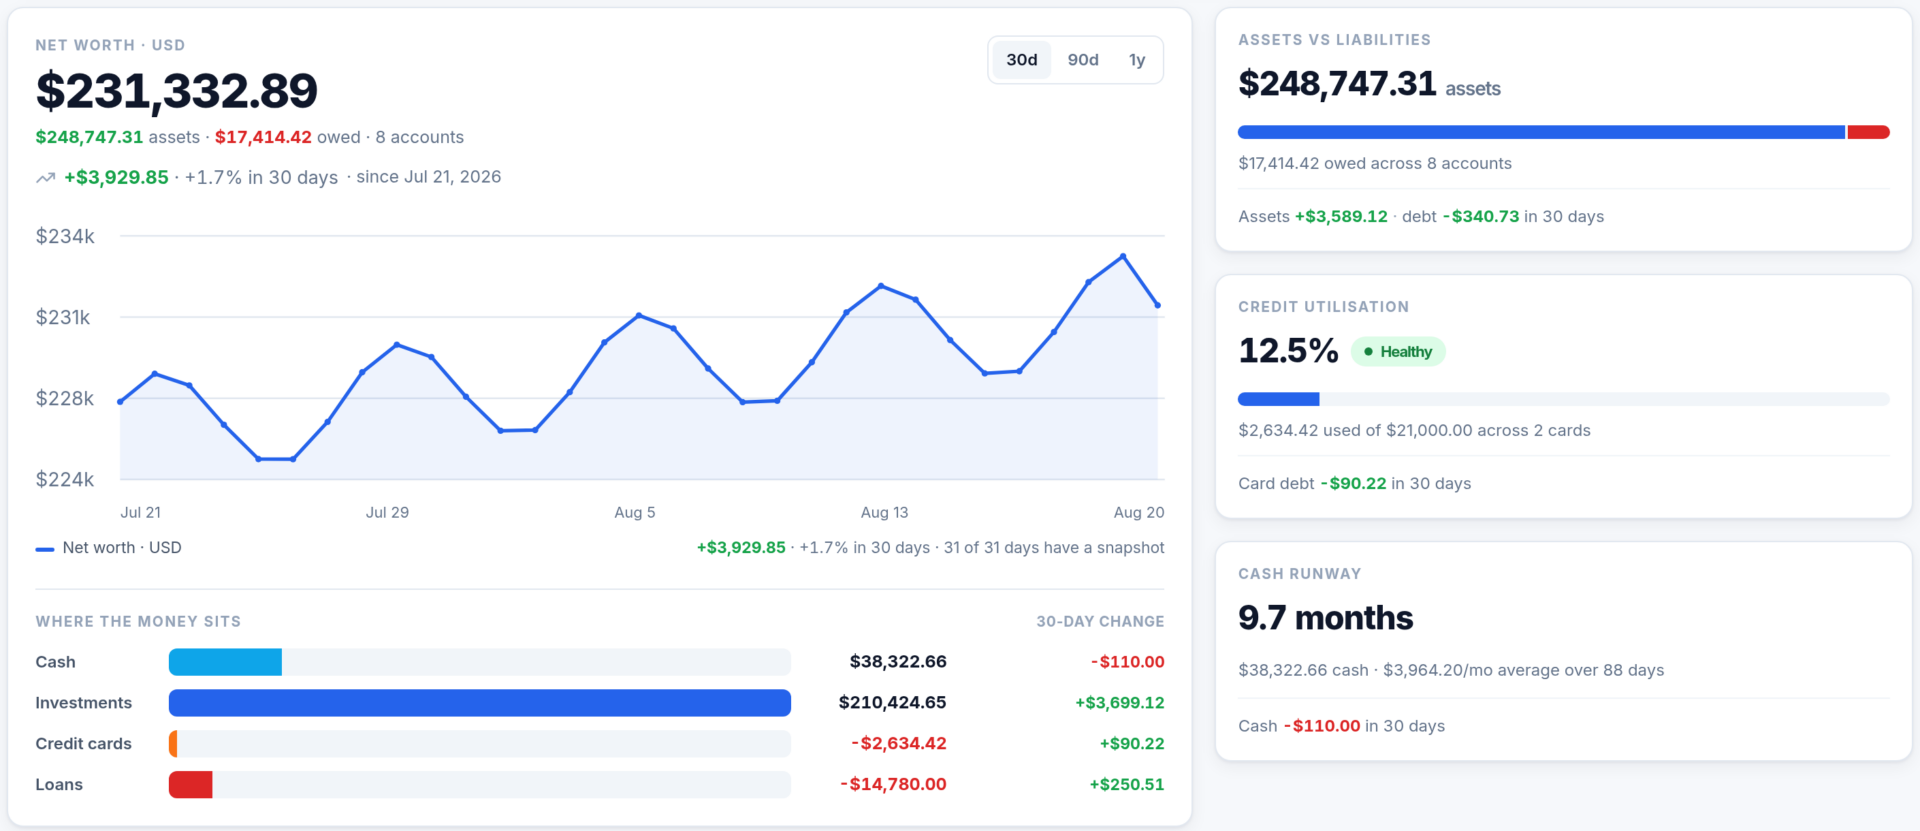
- Investments: portfolio value, unrealised gain, allocation by security type and your largest positions.
- Spending: money out and money in for the range, and the categories it went to.
- Documents: parse quality, match coverage and storage, each with the queue behind it.
Each card links to its own screen, and each says when its figures cover less than everything: a position with no cost basis, a window your bank returned in part, a document that could not be read.
What needs you, and what just happened
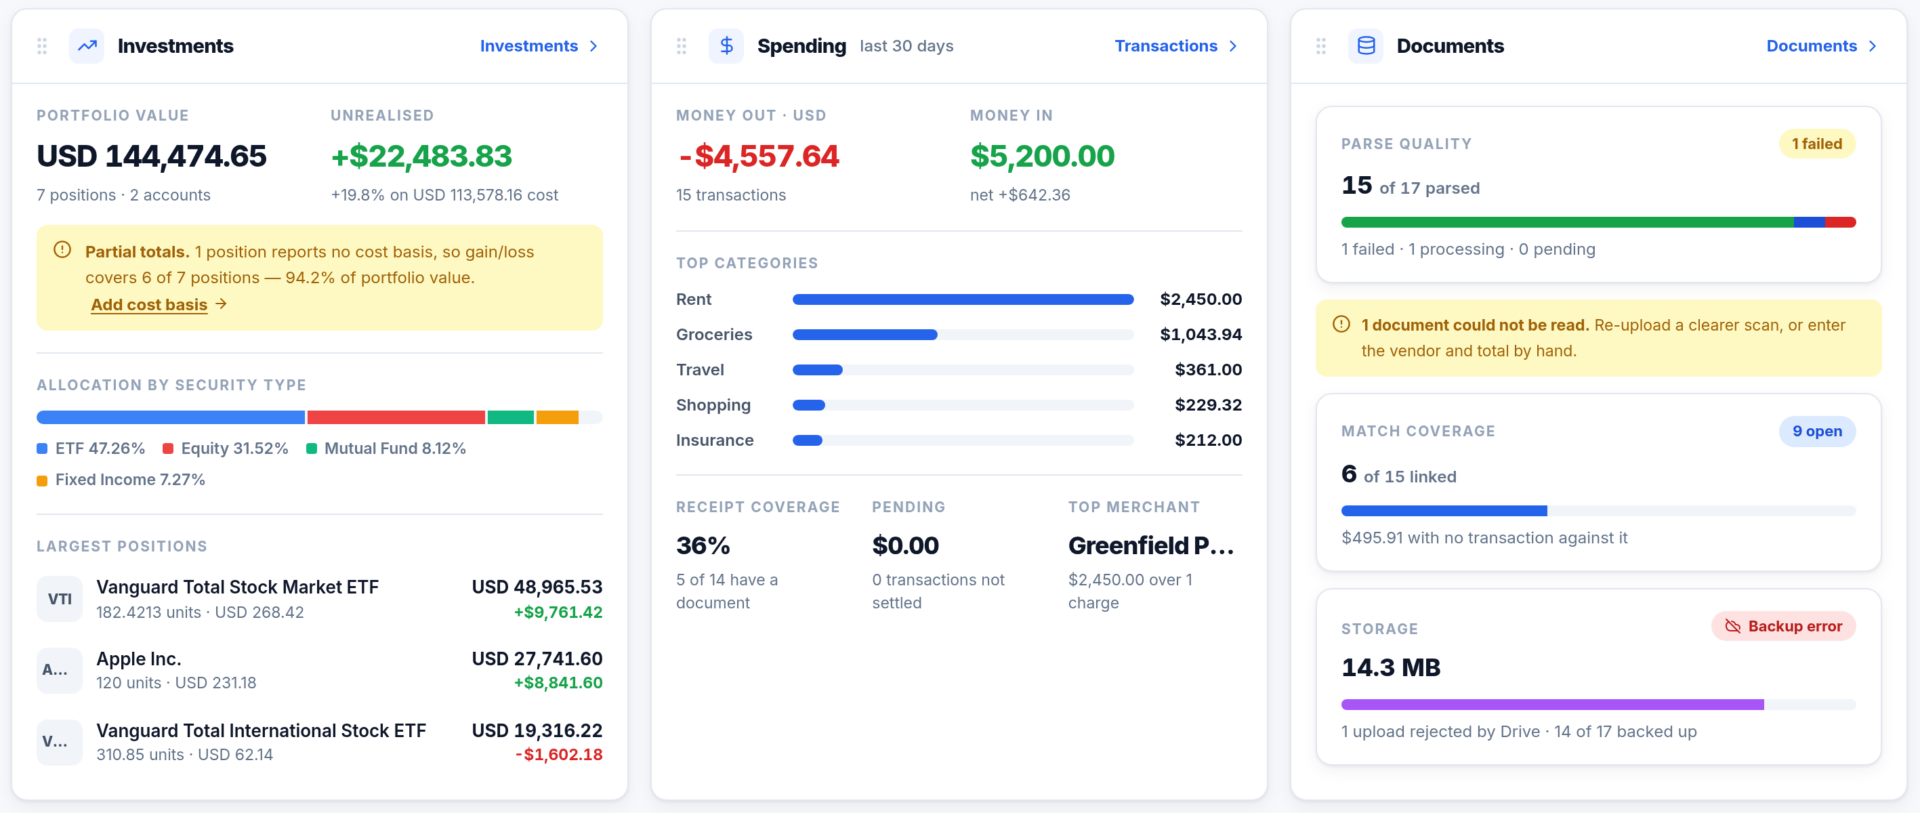
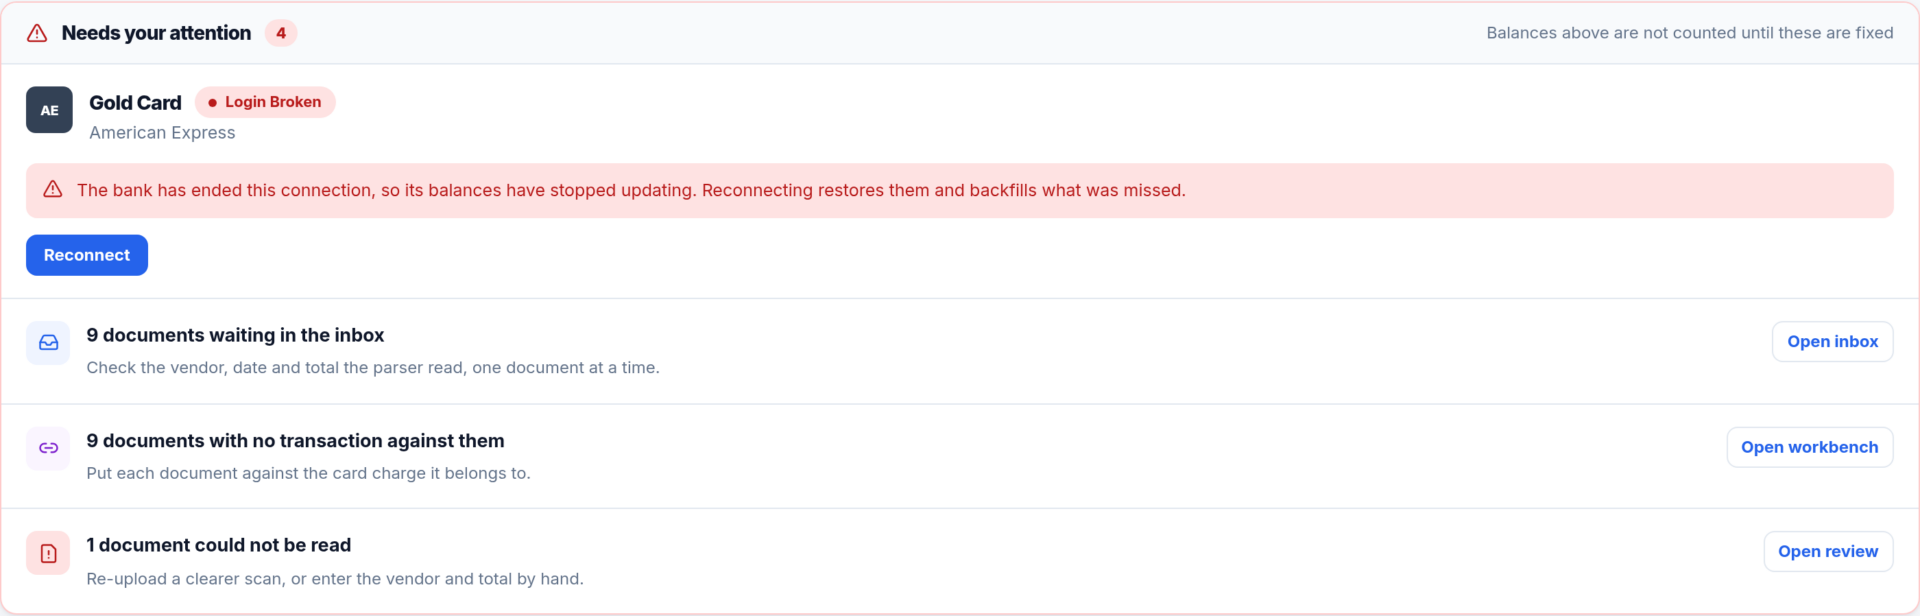
Needs your attention lists broken connections first, then the three document queues: waiting in the inbox, no transaction against them, could not be read. Every row is a count taken from Accounts or Documents, and it disappears the moment that count reaches zero.
Recent activity merges documents, transactions and trades into one list, newest first, so you see the last few days across all four screens without opening any of them.
Before anything is connected
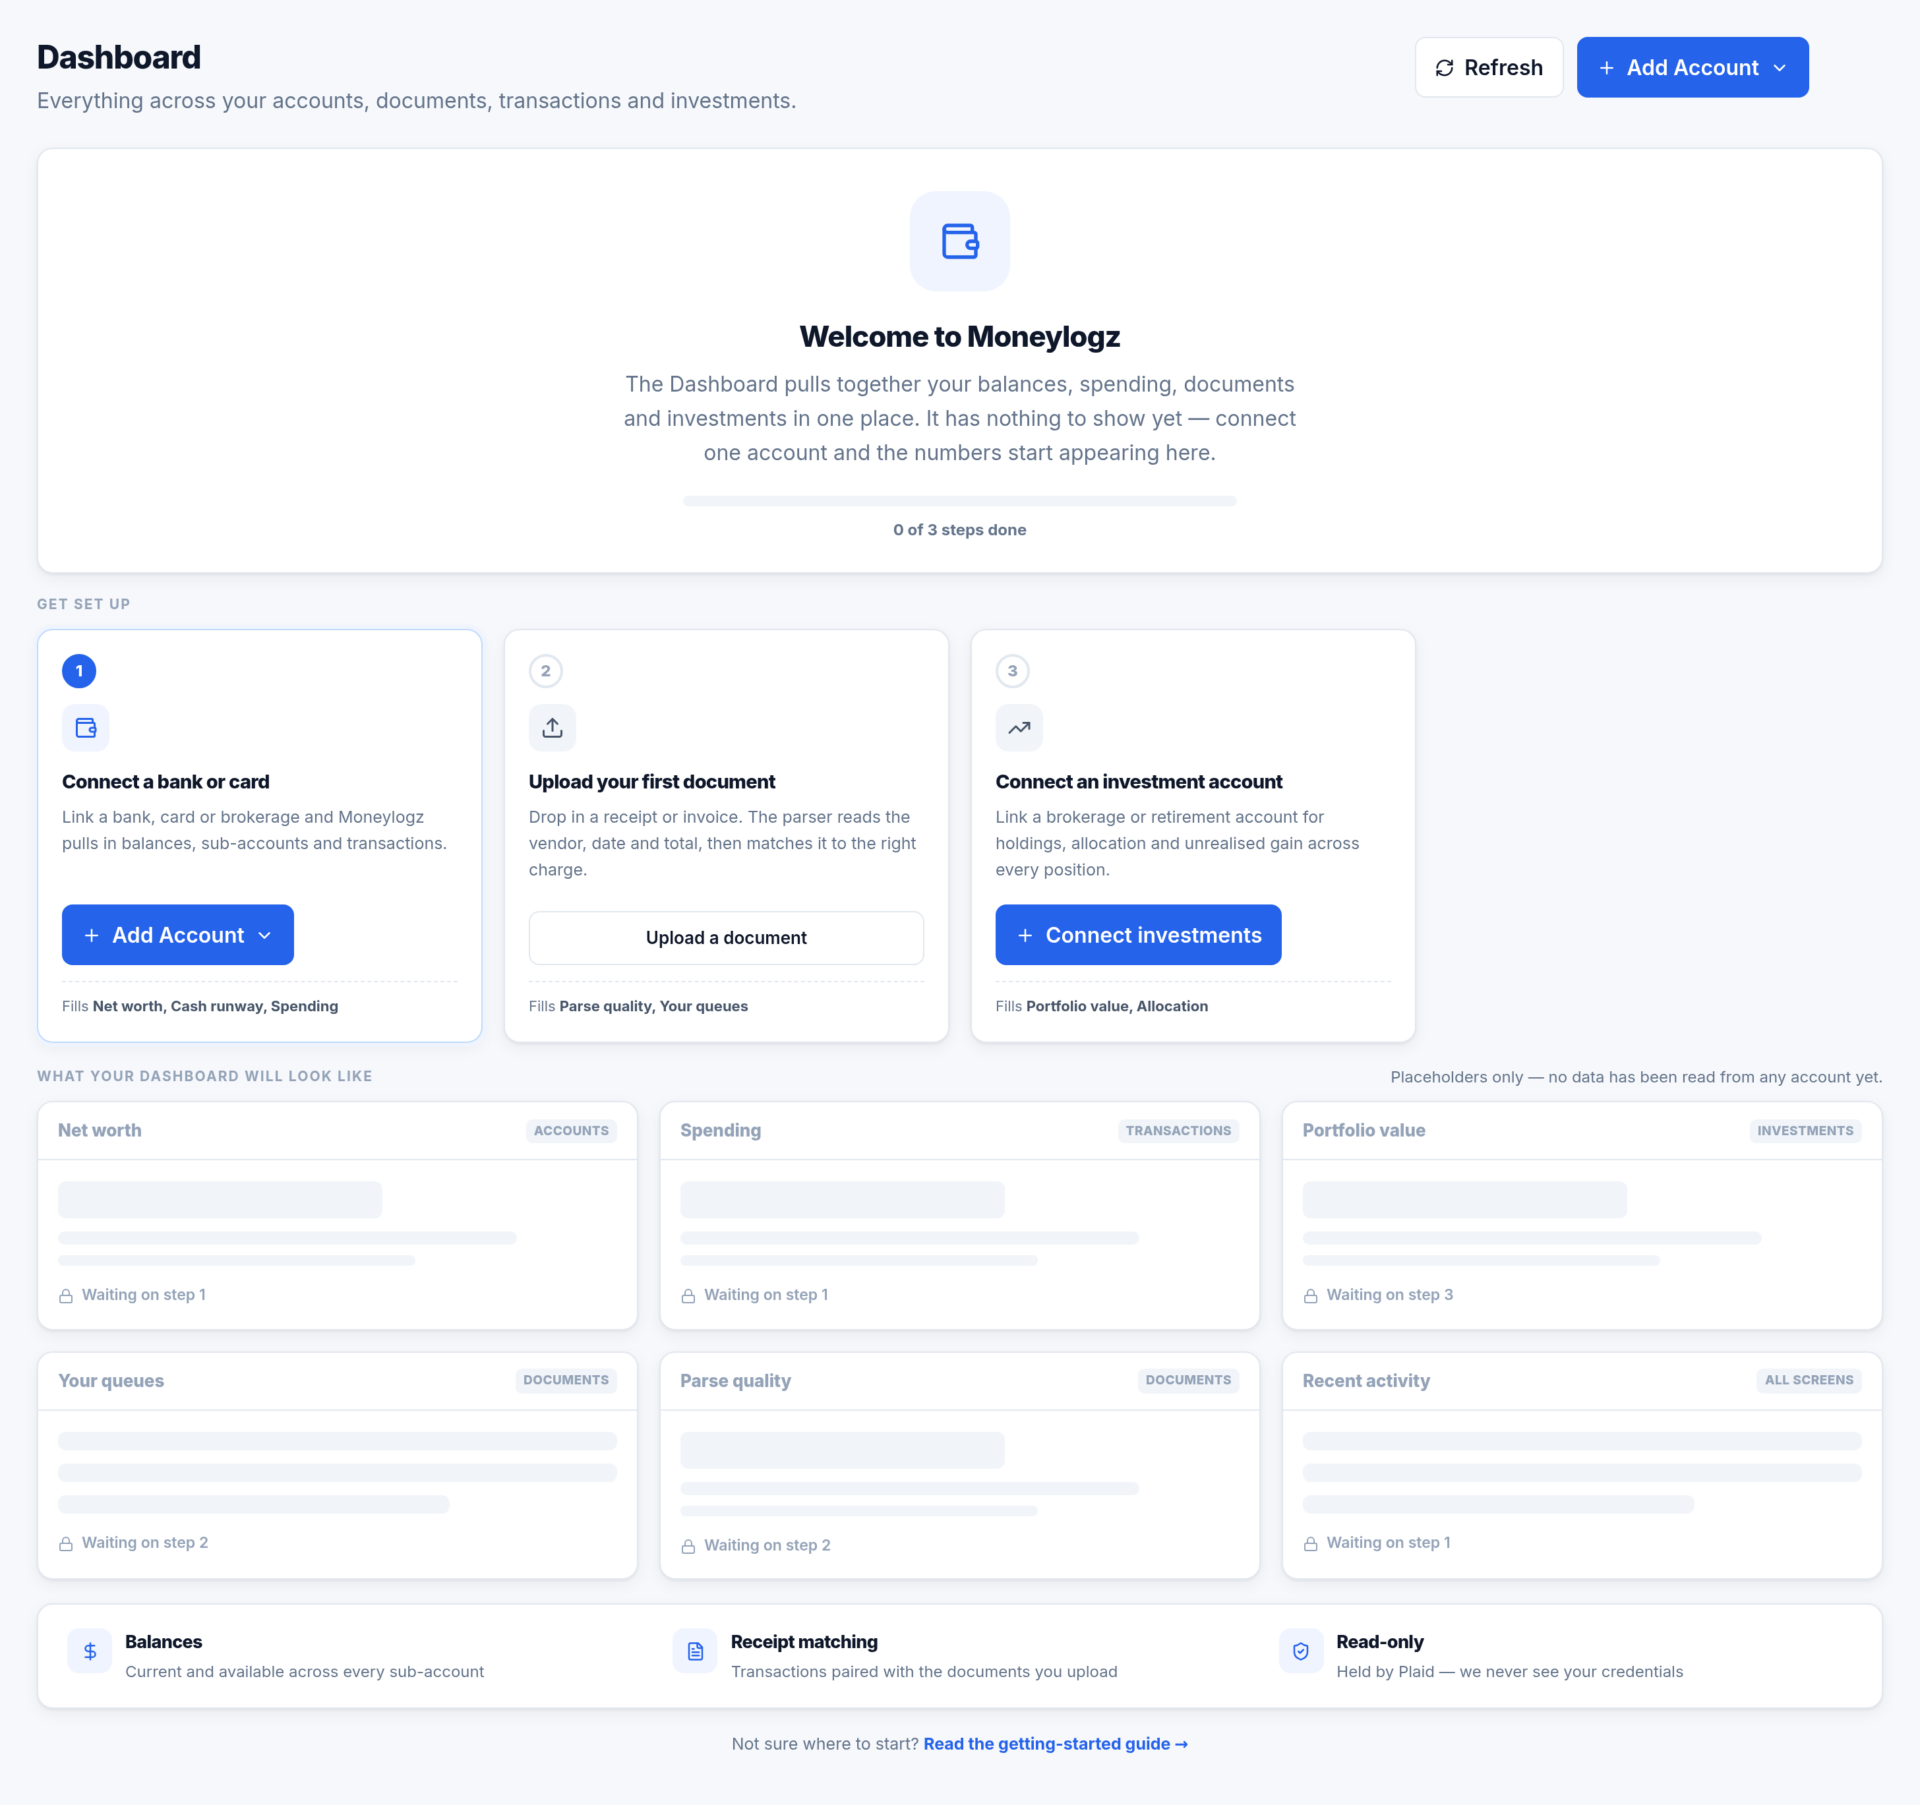
With no bank, card or brokerage linked, the Dashboard shows a four-step checklist instead of empty figures, and ghosts of the widgets each step will fill. Step one unlocks the rest: without a connection there are no balances, no transactions and nothing for a document to match against.
Questions about the Dashboard
How fresh are the numbers?
Every figure is the balance your bank last shared, not a live reading. Banks send updates one to three times a day; Refresh brings across whatever has arrived since, but cannot make an institution report sooner. Each connection shows when it last updated.
Why is my net worth lower than I expect?
A connection that has stopped reporting is left out of the totals and named in the strip above the hero. Reconnect it from Accounts and the figures are restored.
See your own dashboard
14-day free trial on every plan. Connect one account and the first figures are there within minutes.